Disclaimer: This article is for the fellow Adobe Analytics geeks out there 🙂
After working with numerous Adobe Analytics implementations, I have noticed that one particular – and extremely powerful – feature is severely under-utilized. Many are not even aware that this functionality exists; or do not realize just what can be achieved by embracing it: the list variable.
Adobe Analytics’ list variable facilitates collection of huge amounts of useful, structured, listed data. Check out some use cases below, or just skip to the elevator pitch.
If you are on Adobe Analytics, scraping your website for page content data can be easily managed with an out-of-the-box variable called the “list variable”. This variable type gives a lot of flexibility in terms of what data to collect from the website. Some interesting use cases could be:
- Knowing which videos and banners are presented to user – before they are clicked.
- Knowing which messages and CTA’s are presented to the user – and how often they are clicked.
- In a feedback survey, capturing all the answers chosen by the user.
- Knowing which assets are loaded on your site – and the speed at which they each load.
Now that I have your attention – let’s dive into it!
Basic understanding: how the list variable works
If you are reading this, you are probably familiar with how props & eVars work. But in some cases, you might also have stumbled upon their limitations. For instance, props have a 100-byte limit, while eVars have a 255-byte limit. In turn, these variables are not well suited to capture a large amount of website data (i.e. an array of string values) in one single hit – so how do you capture multiple values in one variable on one page view?
Essentially, the list variable can contain an array of items, separated by a delimiter of your own choice. Let’s say you have an article page on your website covering topics like “environment”, “politics”, “economy” and “business”. Instead of having a messy “environment,politics,economy,business” string in an eVar (yuck!), you can separate each item distinctly to easily count, how many times each topic was listed across article views. In your reporting (e.g. in an Adobe Analytics workspace project), you would simply have one row for each topic and how many page views each topic has had. This is a quick way to reveal the most and least viewed topics across your site.
This is easily done by using any tag management solution you would use to deploy your Analytics code on your website. You can read more about the implementation method of the “s.list” variable here.
How to set up your list variable
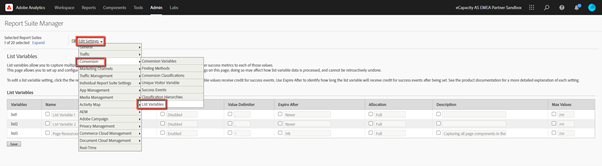
In your report suite manager interface in Adobe Analytics, the list variables can by configured like any variable (found via Admin > Report Suites > Edit Settings > Conversion > List Variables). The screenshots below present the different settings that can apply to a list var:
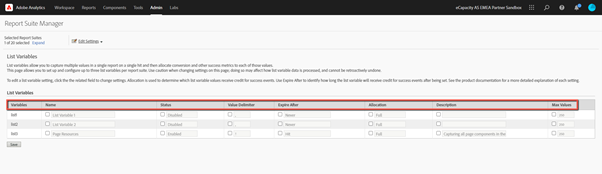
To get a better understanding of these settings and how to configure them properly, this Adobe article is a really helpful start. One important thing to keep in mind here is the following quote regarding the “Expire After” setting: “Variable values are never overwritten, but instead added to the values that get credit for success events.” Let’s say your List Variable is set with expiration: “Never”. In this case all the individual values collected historically in your list variable will be attributed to future success events. You therefore need to be very clear in your reporting requirements to avoid misleading data processing.
So far, so good.
Since we are used to thinking of data collection in “single-value” variables, let me try and share a few examples with you, to hopefully inspire some use cases that you can implement yourself. This can help you get a far better understanding on the visitor’s experience on your website and quickly identify optimization possibilities.
Example 1: Which USP’s are most engaging to the visitor?
Let’s say you’re managing a website selling skateboards of all sorts. All the skateboards displayed on your site have several USP’s listed next to them, e.g. “classic design”, “value for money”, “award winner”. You now want to see if there is a connection between the USP’s and the popularity of your skateboards. This way, you can easily promote skateboards with the most attractive USP’s (or modify the USP wording since you will now know, which skateboard attribute the users value the most). You would like a report to show the following:
| List of USP’s | Product Views | Cart additions | Add to cart rate |
| Classic design | 1053 | 312 | 30% |
| Limited stock | 989 | 141 | 14% |
| Award winner | 882 | 521 | 59% |
| Popular choice | 742 | 412 | 56% |
| Latest model | 521 | 109 | 21% |
| Robust | 491 | 101 | 21% |
You now have an overview of the USP’s listed to the user across all skateboards and know which kind of messaging seems to be the most inviting for the users. You should highlight the skateboards public recognition (since “popular choice” & “award winner”) are the best drivers toward cart addition.
Let’s move on to another example use case of the list variable.
Example 2: reason(s) for leaving
One of your visitors has unfortunately chosen to unsubscribe to the newsletter. To better understand why the user made that decision, you’re asking him/her to tell you the reason for unsubscribing. But as you may know, there can be multiple reasons. Using the list variable, you can easily capture and report on each option individually in the following format:
| Total Responses | 100 |
| Reason for unsubscribing | Reason chosen |
| Irrelevant content | 90 |
| Too many mails | 71 |
| I never read them | 68 |
| Privacy concerns | 41 |
| I don’t remember subscribing | 19 |
| Other | 10 |
| No comment | 8 |
Based on this report, we would argue that by optimizing the email content (e.g. through personalization) and distribution frequency (e.g. advanced targeting), the newsletter emails would be significantly more engaging.
This report would be terrible to maintain in Adobe Analytics without a list variable – thankfully, you have more options with Adobe Analytics.
… But wait, there’s more!
Now that you’ve gotten the idea of the basic concept, let’s dive into some real life use cases, harvesting the fruit of this technology.
Example 3: granular content tracking
This next one can be perceived as anything between mind-blowing and just nonsensical. Stay with me. There is gold at the end of the rainbow.
The above examples have outlined easy ways of capturing multiple values in one variable. But let’s say that each piece of information itself (= each value) contains different relevant aspects you wish to track. For instance, if you wish to track the banners loaded on any given page, it would be relevant to track (1) the banner title, (2) the banner position, and (3) the banner type – all in one and the same list variable item. Your list variable tracking code could look something like this:
s.list1 = “free-trial-promotion|1/3|large-full-width-banner,customer-service-areas|2/3|category-overview,account-login-navigation|3/3|cta-box”.
Your report could then be structured as such after 1012 page views on a page, where all three banners are shown simultaneously:
| Page Component | Page Views | Clicks | CTR |
| free-trial-promotion|1/3|large-full-width-banner | 1012 | 312 | 31% |
| customer-service-areas|2/3|category-overview | 1012 | 42 | 4% |
| account-login-navigation|3/3|cta-box | 1012 | 197 | 19% |
This is useless. Unless you are a developer able to decipher the string values. So how to we make this digestible?
This is where Adobe’s classifications come into play.
Next step in the process of democratizing this data is to make it easy to report on either the page components’ title, page position or type. By using the classifications rule builder within Adobe Analytics, you can easily split each list variable value into precise dimensions – for instance, you could make a report like this:
| Banner Position (Page Component) | Page Views | Clicks | CTR |
| 1/3 | 41159 | 12415 | 30% |
| 2/3 | 41159 | 3180 | 8% |
| 3/3 | 41159 | 881 | 2% |
There we go. Assuming the data above is representative, we now have a benchmark level that says that a top-banner is expected to have a CTR (Click-Through Rate) on 30%. Without the list var, we could simply only say that the top banner had been clicked 12415 times, but we would have no idea if this was something to celebrate or criticize. Now we have access to a lot more granularity and context when it comes to assessing the value contribution of each page component.
Example 4: granular page load speed data
For the last use case, I want to mention Adobe’s ‘performanceTiming’ plugin (which has now been renamed getPageLoadTime). Using the list variable as a key ingredient, this method gives fantastic granularity to understanding exactly which parts of your site that worsens your website load speed. My colleague Troels Moltsen has written a post about the potential value that can be achieved using this data. Click here to see more.
I still don’t get it. What’s the elevator pitch?
I confess, I’m a developer with great interest in understanding the technicalities behind any Analytics implementation. But if, and this is purely hypothetical, you’re NOT an Adobe implementation wizard and just want a summary of this post, here goes:
Adobe Analytics has a unique method of tracking tremendous amounts of website data on every page view, which could become a major asset in your analytics capabilities. This approach is free, using standard functionality and practically limitless. Let your imagination run amok and dream of a massive and structured data collection.
At eCapacity, we are genuinely enthusiastic about the possibilities here, so please reach out if you’d like to discuss some potential use cases in terms of your website data collection.